Free TradingView indicator
PatrickWS Imbalance Finder
Marks price imbalances (fair value gaps) on your chart using three-candle logic, and shows when price starts to fill them.
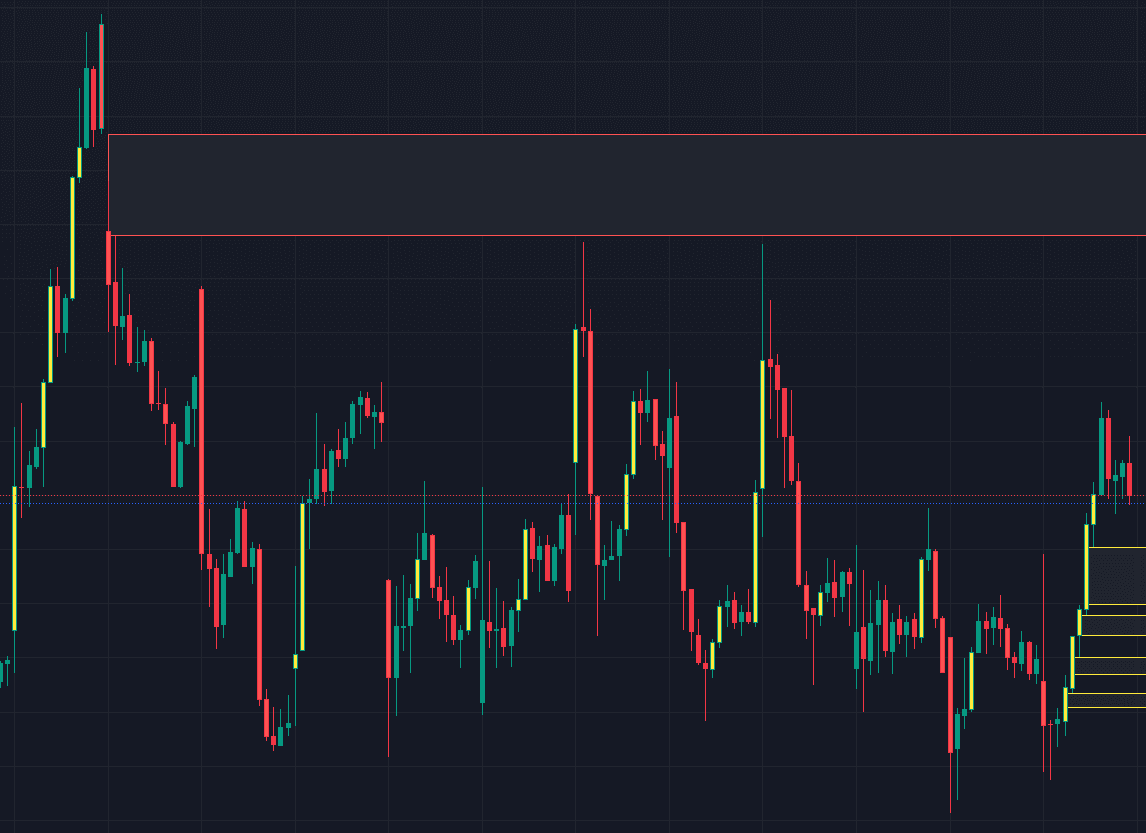
How it works
The script looks at each run of three consecutive candles. When the wicks of the first and third candle leave a gap, that range is marked as a potential imbalance and a box is drawn over it.
As price trades back into a zone, the box border changes from solid to dashed, so you can see at a glance which imbalances are untouched and which are being filled.
It marks zones; it doesn't predict whether price will return to them or react when it does. Most traders use it alongside market structure, key levels and the economic calendar rather than as a signal on its own.
What's included
- Automatic three-candle imbalance detection
- Box border switches from solid to dashed as a zone fills
- Custom colors for candles and imbalance boxes
- Limit on how many boxes are shown, to keep charts readable
- Runs on any chart timeframe
- Lightweight Pine Script v5 code
Planned improvements
An extended version is in development, with features such as alerts when price enters or fills a zone, multi-timeframe zones and fill tracking. A MetaTrader 5 version is also being considered. Neither has a release date, and neither is available yet.
Get Imbalance Finder updates
We'll email you about updates to the indicator, including if an extended or MetaTrader 5 version is released.
FAQ
What is an imbalance?
An imbalance (also called a fair value gap) is a three-candle pattern where the wicks of the first and third candles don't overlap, because the middle candle moved price quickly through a range. Price sometimes returns to trade through that range later, so traders mark these zones as areas of interest. Many are never revisited, and many that are revisited don't hold.
Is the indicator free?
Yes. The Imbalance Finder is published as a free, protected (closed-source) indicator on TradingView. You need a TradingView account to add it to a chart.
Is there a MetaTrader 5 version?
Not currently. An MT5 version and an extended TradingView version are being considered, but there is no release date and nothing to download yet. The update list below is the way to hear if that changes.
What timeframes can I use it on?
It runs on whatever timeframe your chart is set to. Lower timeframes produce many more zones, most of them small; many traders find higher timeframes such as H1, H4 and daily easier to read.
Does it tell me when to buy or sell?
No. It marks where imbalances formed and whether price has started to fill them. Whether a zone is worth trading depends on your own analysis, such as trend, structure and upcoming news, and on your risk management.